Our mission is to remain standing strong amidst the macroeconomic uncertainties and stay competitive in the face of increasing competition. Through a series of growth capital investments and strategic positioning of the Group, we will continue to consolidate our resources for the right move to capitalise on the profitable opportunities that will achieve greater impact for our business expansion plans, while creating financial stability for our continuing growth towards the next millennia

19 Sep 2024
18 Sep 2024
13 Sep 2024
12 Sep 2024
11 Sep 2024
6 Sep 2024
4 Sep 2024
4 Sep 2024
2 Sep 2024
30 Aug 2024
27 Aug 2024
26 Aug 2024
23 Aug 2024
22 Aug 2024
21 Aug 2024
20 Aug 2024
19 Aug 2024
19 Aug 2024
16 Aug 2024
15 Aug 2024
14 Aug 2024
13 Aug 2024
13 Aug 2024
13 Aug 2024
13 Aug 2024
12 Aug 2024
8 Aug 2024
7 Aug 2024
6 Aug 2024
6 Aug 2024
5 Aug 2024
2 Aug 2024
2 Aug 2024
1 Aug 2024
1 Aug 2024
1 Aug 2024
1 Aug 2024
1 Aug 2024
31 Jul 2024
29 Jul 2024
17 Jul 2024
10 Jul 2024
10 Jul 2024
10 Jul 2024
10 Jul 2024
10 Jul 2024
10 Jul 2024
28 Jun 2024
26 Jun 2024
3 Jun 2024
14 May 2024
10 May 2024
2 May 2024
1 Apr 2024
27 Mar 2024
26 Mar 2024
19 Mar 2024
1 Mar 2024
1 Mar 2024
1 Feb 2024
18 Jan 2024
10 Jan 2024
30 Dec 2023
21 Dec 2023
21 Dec 2023
20 Dec 2023
14 Dec 2023
13 Dec 2023
1 Dec 2023
1 Dec 2023
1 Dec 2023
1 Dec 2023
15 Nov 2023
15 Nov 2023
9 Nov 2023
7 Nov 2023
6 Nov 2023
30 Oct 2023
22 Oct 2023
20 Oct 2023
2 Oct 2023
10 Jul 2023
3 Jul 2023
15 Jun 2023
5 May 2023
10 Apr 2023
4 Apr 2023
29 Mar 2023
29 Mar 2023
21 Mar 2023
20 Mar 2023
10 Mar 2023
9 Mar 2023
1 Mar 2023
28 Feb 2023
27 Feb 2023
20 Feb 2023
8 Feb 2023
7 Feb 2023
6 Feb 2023
| 2019 | 2020 | 2021 | 2022 | 2023 | |
|---|---|---|---|---|---|
| Revenue | 30,764 | 23,953 | 36,584 | 43115 | 41,906 |
| Profit Before Tax | 5,456 | 3,727 | 10,737 | 14,917 | 20,246 |
| Profit After Tax | 4,745 | 4,445 | 9,823 | 14,196 | 19.656 |
| Dividend (Net) | 0.4cps | 0.45cps | 5.5cps | 1cps | 0.55cps |
| Properties & Fixed Assets | 180,999 | 176,928 | 159,150 | 145,374 | 91,906 |
| Total Assets | 288,276 | 283,440 | 401,800 | 402,591 | 378,000 |
| Net Current Assets | 25,190 | 10,115 | (89,537) | (42,514) | (53,117) |
| Net Tangible Assets | 262,127 | 248,934 | 283,216 | 283,384 | 283,285 |
| Capital Employed | 262,127 | 248,934 | 283,216 | 283,384 | 283,285 |
| Share Capital | 138,248 | 138,308 | 137,454 | 174,366 | 174,707 |
| Current Ratio | 1.99 | 1.29 | 0.24 | 0.64 | 0.44 |
| Debt to Equity Ratio | 0.10 | 0.14 | 0.42 | 0.42 | 0.33 |
| Capital Gearing Ratio | 0.04 | 0.09 | 0.41 | 0.39 | 0.32 |
| Earnings Per Share (cents) | 0.63 | 0.59 | 1.30 | 1.66 | 2.12 |
| Price/Earning ratio | 33.33 | 30.17 | 21.54 | 14.16 | 10.85 |
| NTA Per Share (cents) | 34.72 | 32.96 | 37.67 | 30.59 | 30.53 |
| Interest Coverage Ratio | 8.14 | 14.56 | 25.29 | 17.87 | 7.57 |
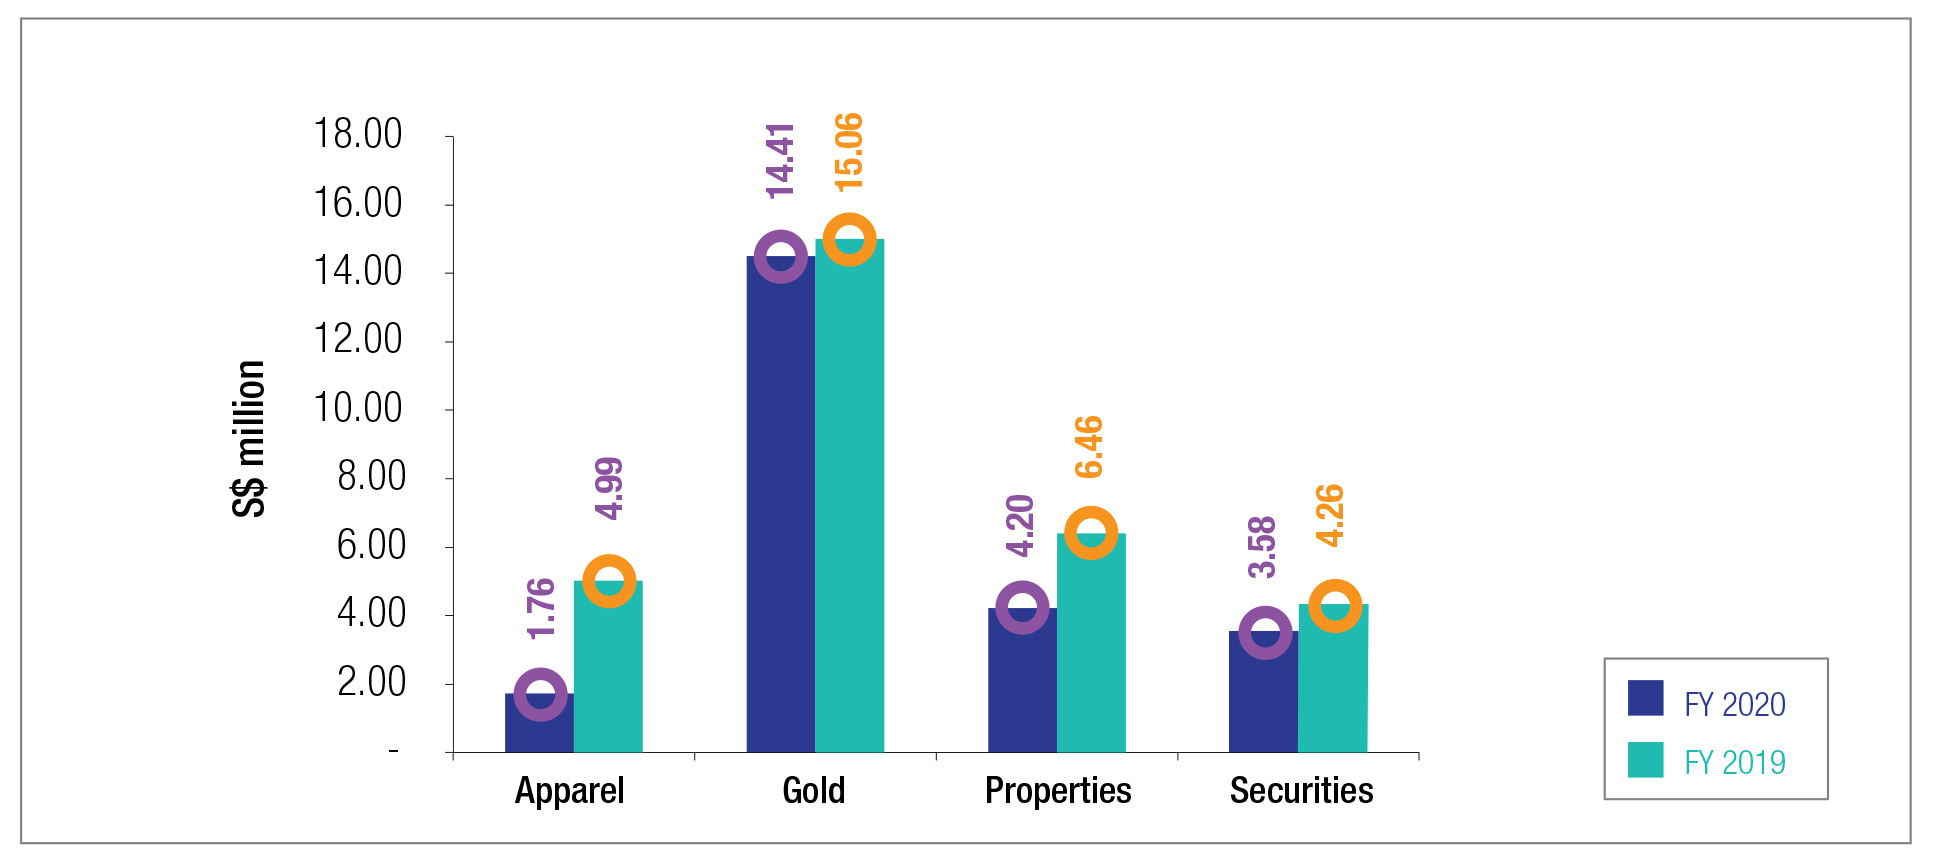
| Revenue | FY 2020 S$ million | FY 2019 S$ million | Variance S$ million | Variance % |
|---|---|---|---|---|
| Apparel | 1.76 | 4.99 | (3.23) | (64.73) |
| Gold | 14.41 | 15.06 | (0.65) | (4.32) |
| Properties | 4.20 | 6.46 | (2.26) | (34.98) |
| Securities | 3.58 | 4.26 | (0.68) | (15.96) |
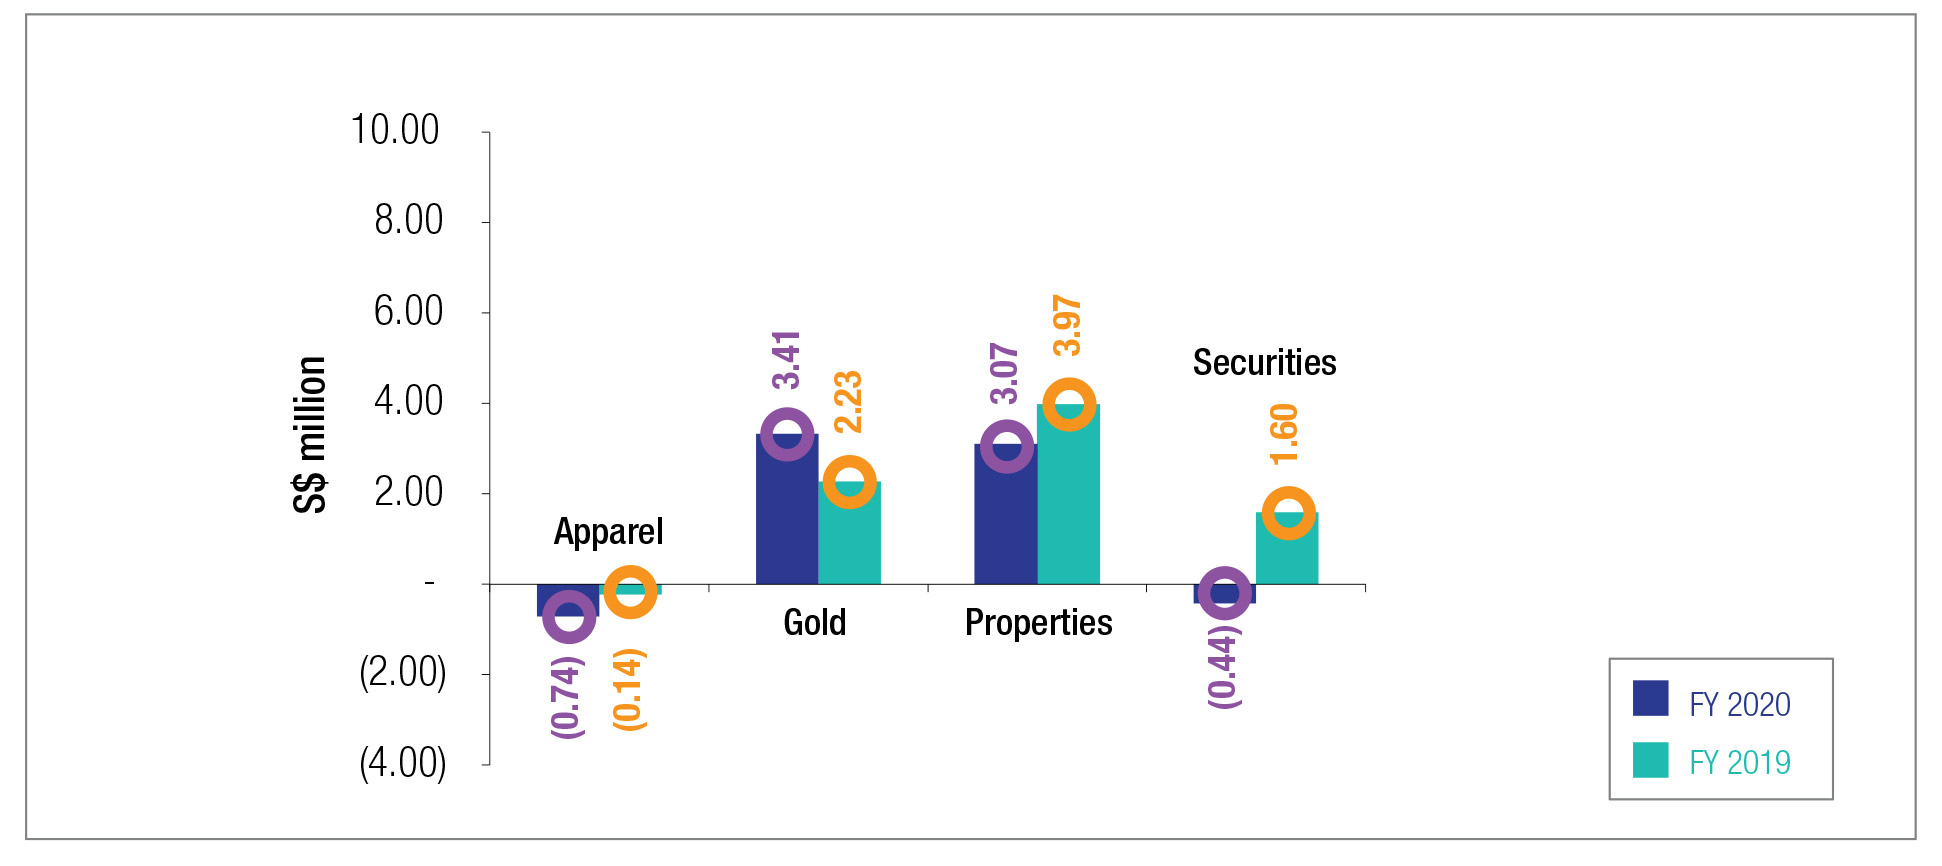
| FY 2020 | FY 2019 | Variance S$ million | Variance % |
|
|---|---|---|---|---|
| Apparel | (0.74) | (0.14) | (0.60) | 428.57 |
| Gold | 3.41 | 2.23 | 1.18 | 52.91 |
| Properties | 3.07 | 3.97 | (0.90) | (22.67) |
| Securities | (0.44) | 1.60 | (2.04) | nm* |
*no meaning
Dear Mohd Salleh,

Thank you for your prompt reply. We are indeed pleased to have an enlighten
Company like Second Chance Properties Limited.
Wishing you and your family a great 2017 ahead too.

With kind regards,
David Gerald
Founder, President & CEO
Securities Investors Association (Singapore)